The Crime Index
Hyperobjekt worked with crime data experts AH Datalytics to redesign their successful real-time crime rate tracking tools, and add historical data for over 19,000 law enforcement agencies nationwide.
Go to site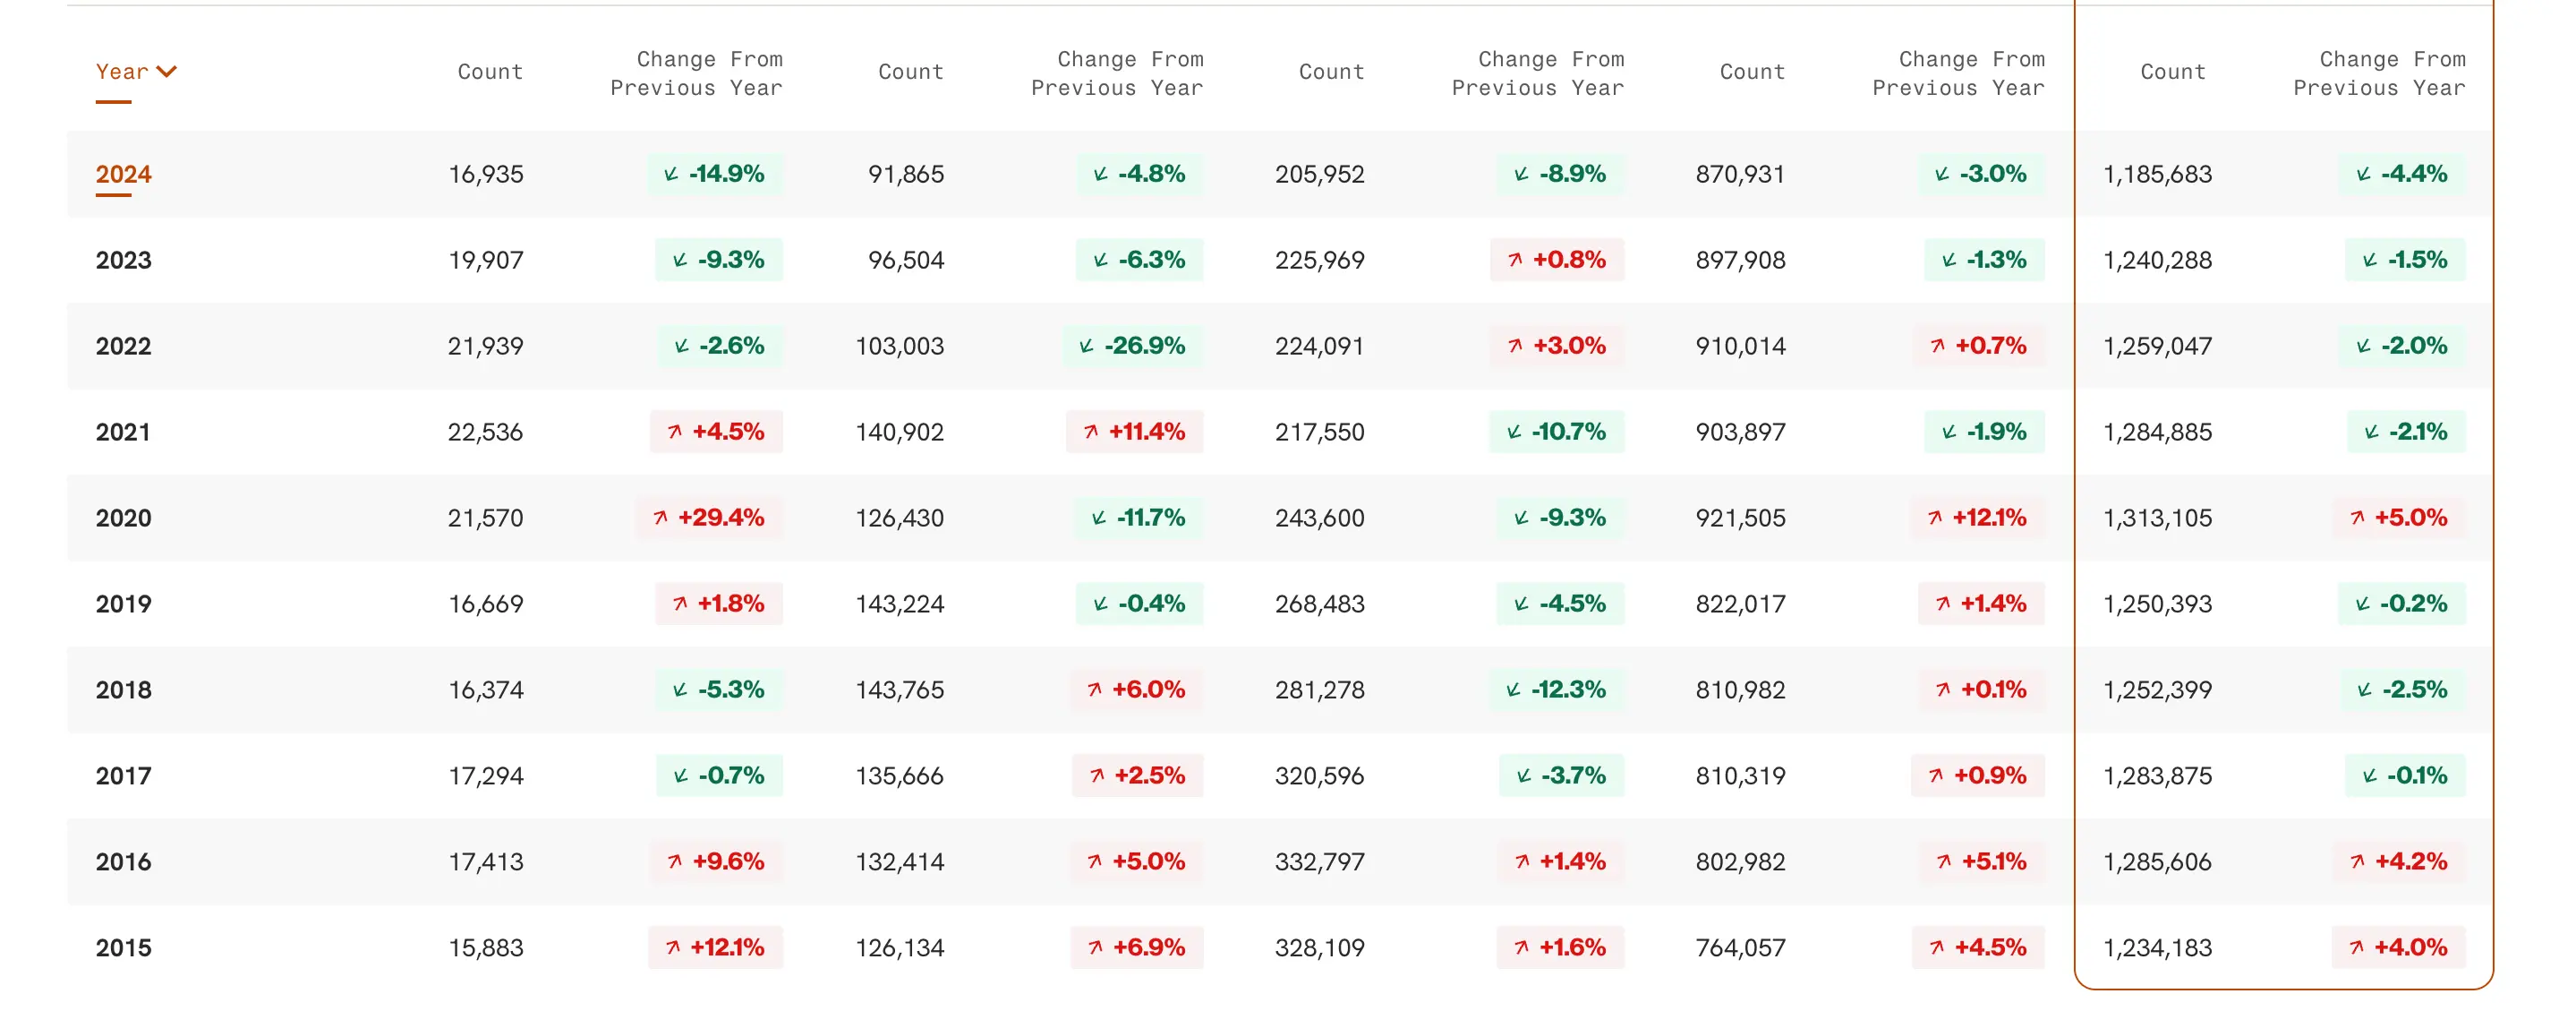
The Crime Index presents a unique sample of crime data gathered monthly from over 500 law enforcement agencies, providing users with a more real-time view of violent and property crime trends than is possible from the FBI’s annual reports.
Background
About the Client
AH Datalytics is a leading analytics and consulting firm that specializes in crime, education, and other public interest data insights. AH Datalytics launched the Real-Time Crime Index (RTCI) in 2024, supported by Arnold Ventures, with the goal of creating a tool that would measure crime trends nationally as they occurred, rather than on an annual basis. The new Crime Index is the successor to the RTCI pilot.
About the Project
The result of a year-long collaboration between AH Datalytics and Hyperobjekt, The Crime Index is the most expansive interactive crime statistics web application to date. The purpose of the project was to redesign and improve the precursor Real-Time Crime Index pilot and combine it with deep historical data on thousands of law enforcement agencies dating back to 1930. Our team began the project with an extensive discovery process that established a fully reenvisioned data model to efficiently support expanded Current and Historical interfaces, as well as easy CMS- and file-based updating of data.
Our user experience experts and designers then set about creating an intuitive, visually-rich, interactive interface that captured important stories the AH Datalytics team identified—recent encouraging trends in murder rates, plunging instances of motor vehicle thefts, and more. Finally, Hyperobjekt's development team coded the interactive visualizations and data discovery tools through many refinements and optimizations over the months leading to launch.
Goals and challenges
- Redesign and redevelop the Real-Time Crime Index pilot project into a cleaner, more streamlined interface
- Incorporate the full history of annual FBI crime data into a large repository dating back to 1930, extending crime analysis with information previously locked in scanned PDF documents
- Create a unified user experience and visual design between Current and Historical interfaces, while accounting for many exceptions and data idiosyncrasies between the tools
- Create a dashboard-style landing page to give users the latest crime trends at a glance
- Allow easy exploration of crime data for nove, user-defined combinations of agencies and geographies
Solutions and Features
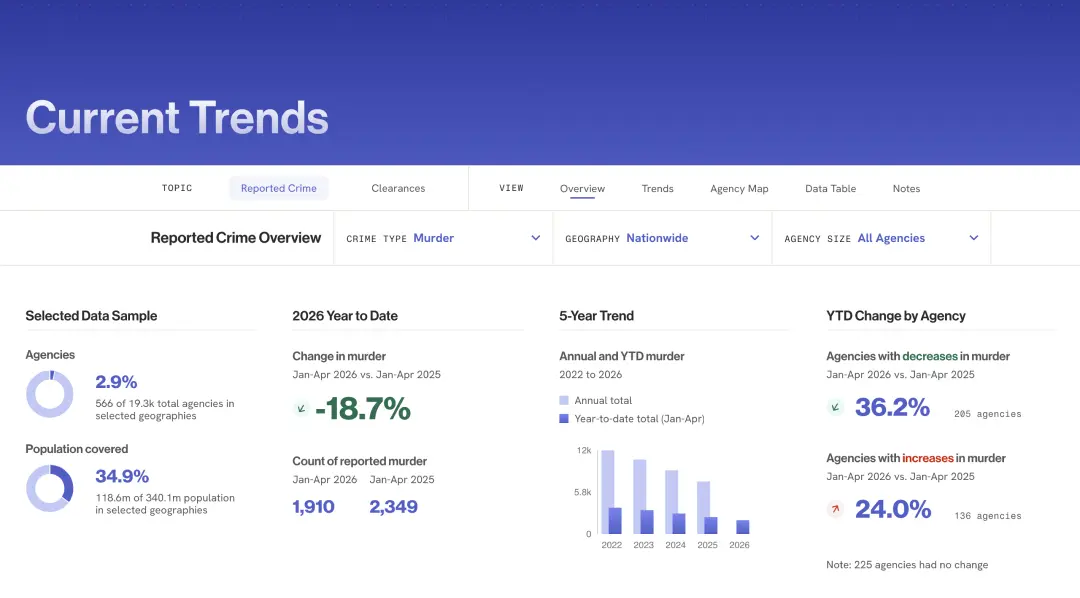
Current Trends replaces the Real-Time Crime Index pilot project with newly designed visualizations such as rolling 12-month totals, monthly crime counts, a map of change in crime, sortable table view, and an easily accessible overview of the latest trends.
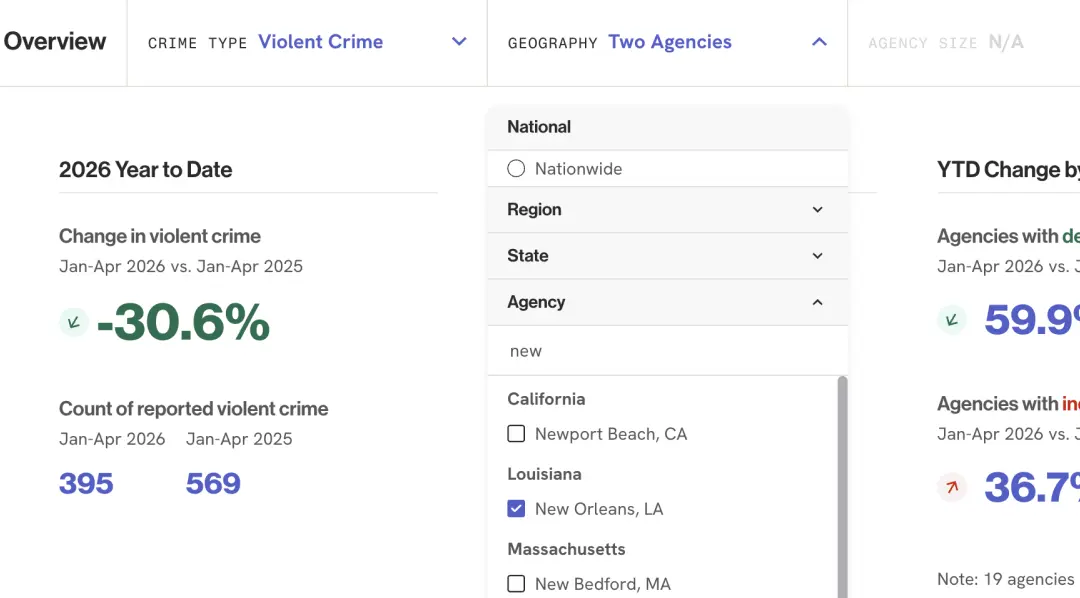
Users can create novel combinations of geographic regions or individual law enforcement agencies.
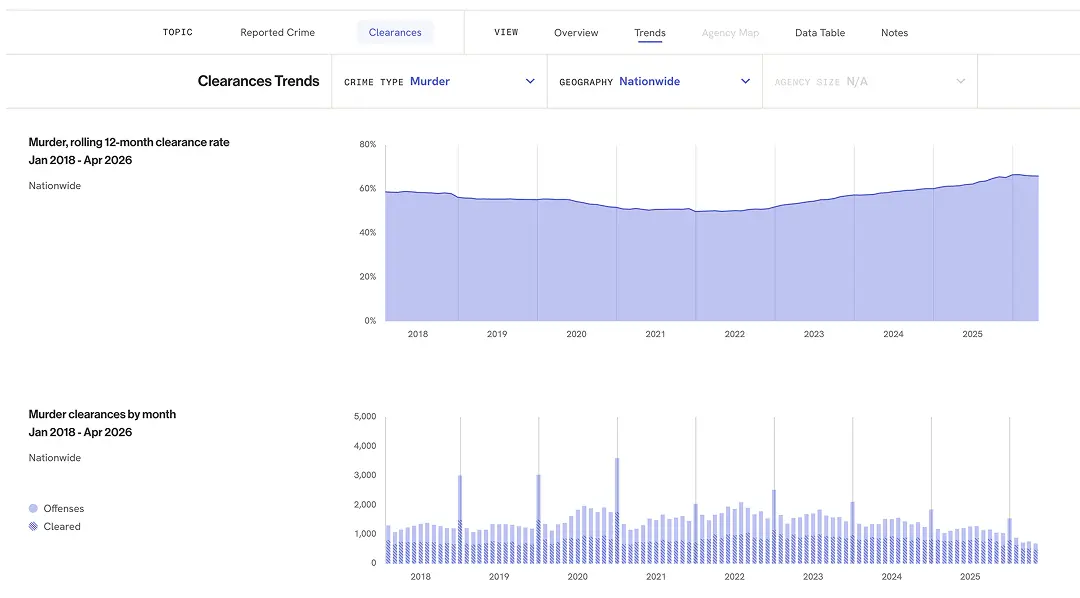
Clearance rate data are a new addition to the application, showing how many reported incidents have been cleared—resolved, either with an arrest or by other means—for each crime type.
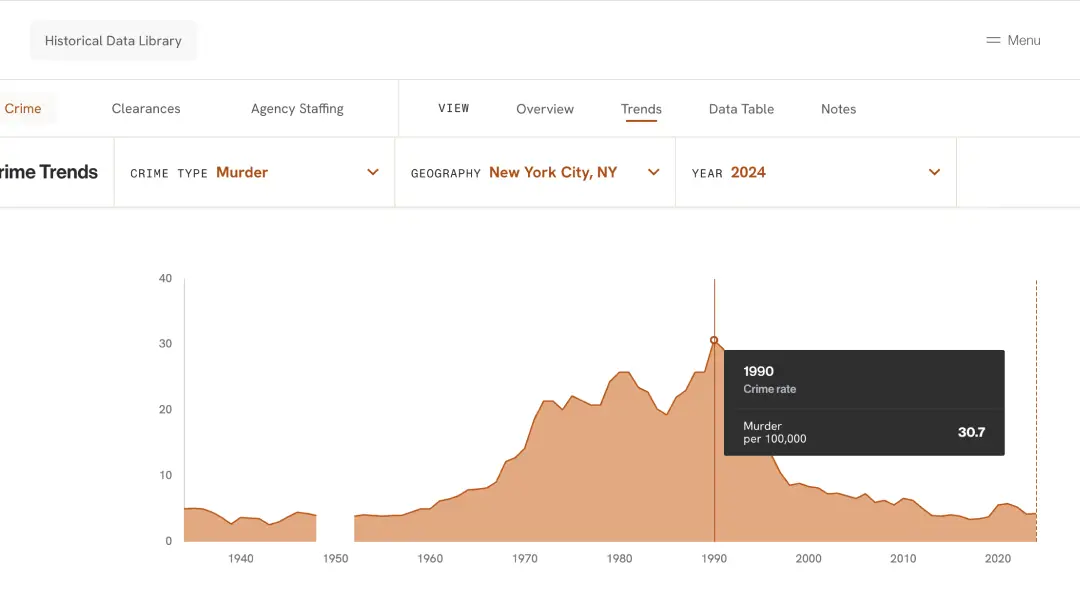
Historical trends for every major crime type are available for over 19,000 law enforcement agencies nationwide dating back to 1930.
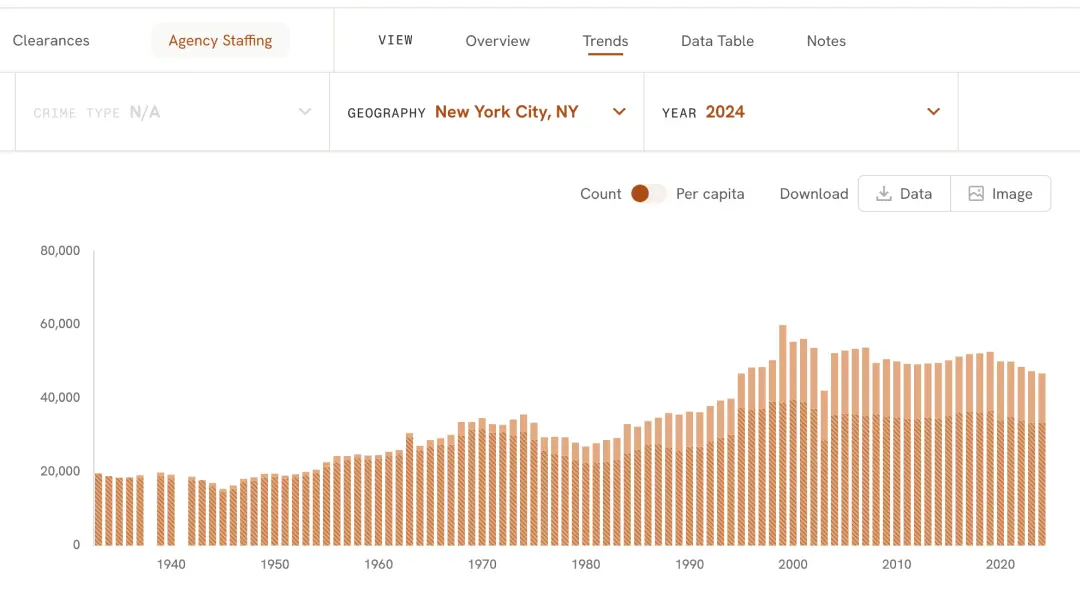
For the first time, view staffing data—both officers and civilians—for individual law enforcement agencies back to 1930.
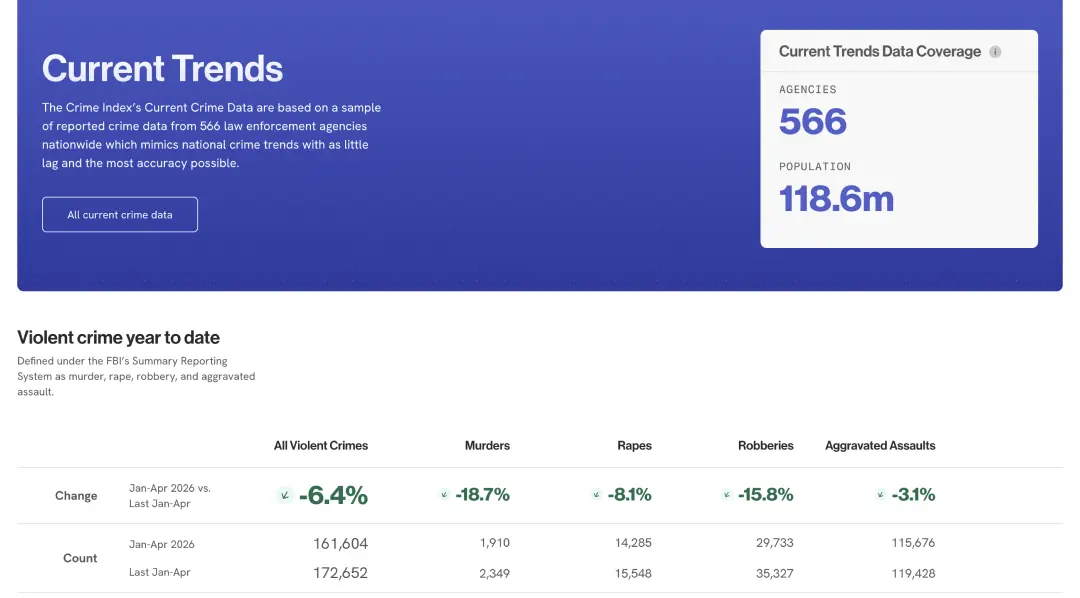
View the latest trends at a glance using the new dashboard-style landing page.
Coverage and Impact
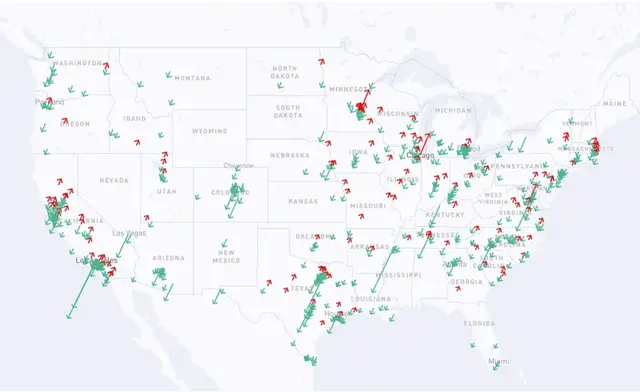 We [now] know the national crime trends with pretty good precision as they occur. If murder stops dropping we’ll know it, if motor vehicle theft keeps plunging we’ll know it, if violent crime starts to level out we’ll know it.
Interested in working with us?
Please use the contact form or write to us at info@hyperobjekt.com
